I wrote this while my time at Attivio. Sharing this here as a contribution since the main website may have revamped. I am not representing Attivio here or marketing its products.
The release of Active Intelligence Engine® (AIE®) Version 3.5 introduces an important set of new functions. Besides introducing new modules like Ontologies; features such as index rollback, image thumbnailing, and document preview and many essential enhancements including SQL, we have improved built-in support for monitoring the performance and health of your AIE infrastructure.
Version 3.5 offers a new user experience for those responsible for administration of AIE, defining the steps they need to take in order to act upon the areas in need of prompt action and quick turnaround. Monitoring and diagnosing AIE now involves little more than checking a screen or two in the AIE Administrator Console.
The key new administration features in AIE 3.5 include:
- System Status — a one stop view of AIE system health
- Performance Monitor — a rich visualization of key AIE performance metrics
- System Events — a filterable collection of all system events emanating from AIE
Each view offers visual insights into what’s happening in AIE at any given moment, simplifying system administration. As a result, the time to discover and resolve issues is shortened, and the user experience is improved.
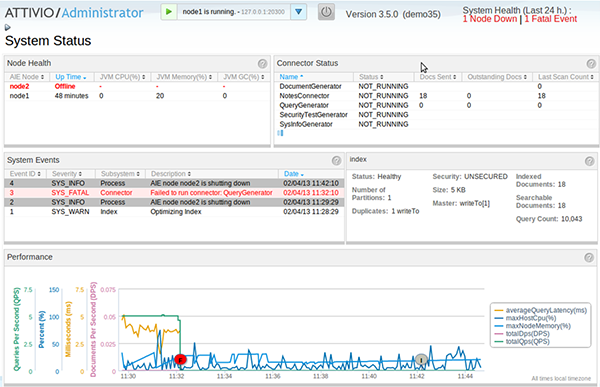
A new System Health Banner, which appears on every screen in the Administrator Console, summarizes the holistic picture of AIE health for administrators. The banner complements the System Status view, which — as the default view in the console — breaks AIE’s status down into individual areas: Node Health, Connector Status, Important Events, Index Status and System Performance.
This view allows administrators to easily connect the dots and essentially helps them answer the question “Is there a problem with my system right now that needs my attention?.” They are able to consume larger sets of information quickly and target the parts that may be relevant without visiting respective detailed views in other parts of the Admin Console.
This Administrator Console presents you with unified answers rather than forcing you to sort through lengthy tables of numbers as we see in legacy management user interfaces. For instance, with the Connectors view, users can now see connectors that are not running as expected, scan the list of recent events in the adjacent Important Events view and start to compile a set of root causes behind any connector issues without ever leaving the System Status view. Events at a warning or fatal level can be investigated to quickly ascertain what specific AIE instances or connectors were affected and why. The Event Acknowledgement Dialog solves the dual purpose of providing all pertinent information on the event and letting the user mark the event as being seen and/or resolved.
Index Status not only describes a selected index’s configuration, but also related statistics. Looking at this information, one can determine for instance, if the index size has doubled within a day, indicating a potential performance spike. The Performance view’s graphical visualization of crucial metrics lets you pinpoint bottlenecks that may warrant immediate attention.
Consider a scenario where, as an administrator, you notice that the System Health Banner is reporting a warning event that occurred in the past 24 hours. You go over to the System Status view and find that an event occurred pointing to low disk space on a node. If unchecked, this might become a factor in creating search performance and node health related problems. You open the Event Details dialog and dig deeper into the event description to find more information about the node. At this point, you can make an informed decision on adding more disk space and taking additional measures.
On the new Performance Monitor view, we provide even deeper insight and flexibility by giving you more than 700 pre-built metrics to graph. By creating multiple graphs, grouping specific metrics together onto one graph and zooming and panning, while having system events superimposed on the timeline, you can chart out a more informed investigation. Unlike the System Status view, which is intended to push summarized, timely and relevant information to you, the Performance Monitor helps you understand specific aspects of the system.
For instance, let’s say that users of an application using AIE reported issues with sluggish search functionality today around noon. One could quickly create a graph and add specific metrics like:
- Uptime across all nodes
- memoryPct — i.e. percentage of memory being used
- os.memory.free — i.e. free memory in the OS
- nodeCPU across nodes — the CPU usage across all nodes
Looking at these metrics in parallel over a timeframe, one can zero in on the bottleneck that was causing search to be slow.
For our customers, these are game changing capabilities. As Fahim Siddiqui, Chief Product Officer, IntraLinks states, “AIE’s event-driven system and performance management have set a new standard of excellence that means we are able to proactively identify and resolve issues. For us, Attivio’s Active Intelligence Engine is not just a technology; it’s a key piece of our overall commitment to providing the best possible experience for our customers.”
As we move forward, we could not be more excited. We have some cool new features lined up that will showcase Attivio’s innovative user centric approach, not only in managing AIE but also in effectively putting the power of unified information access to work in your organization.
